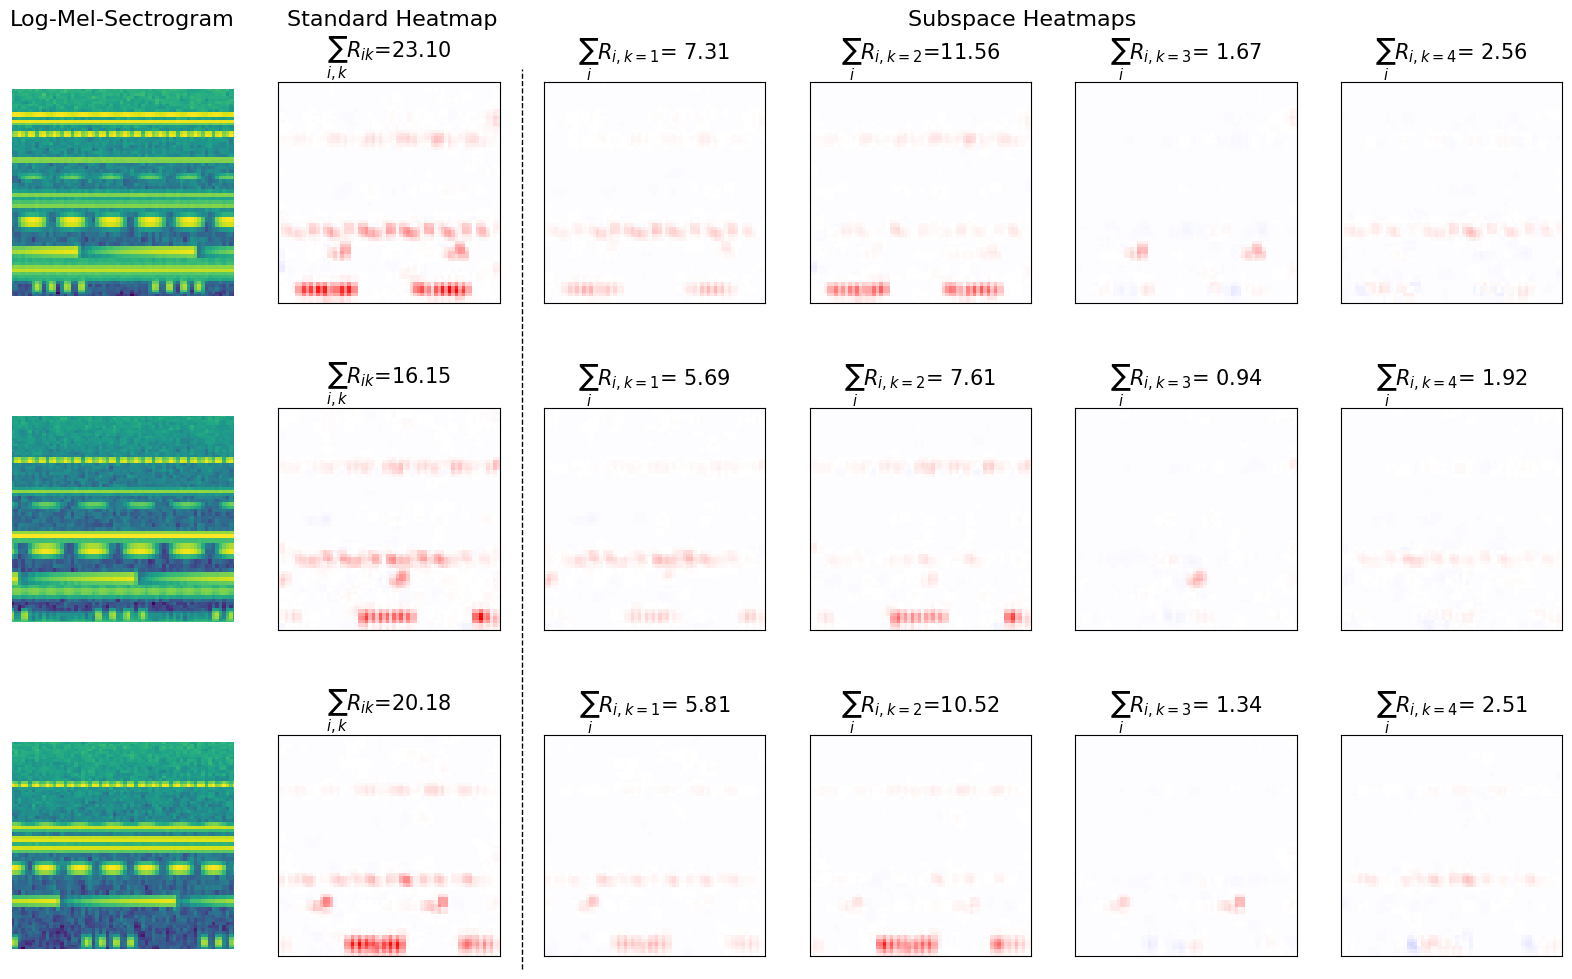
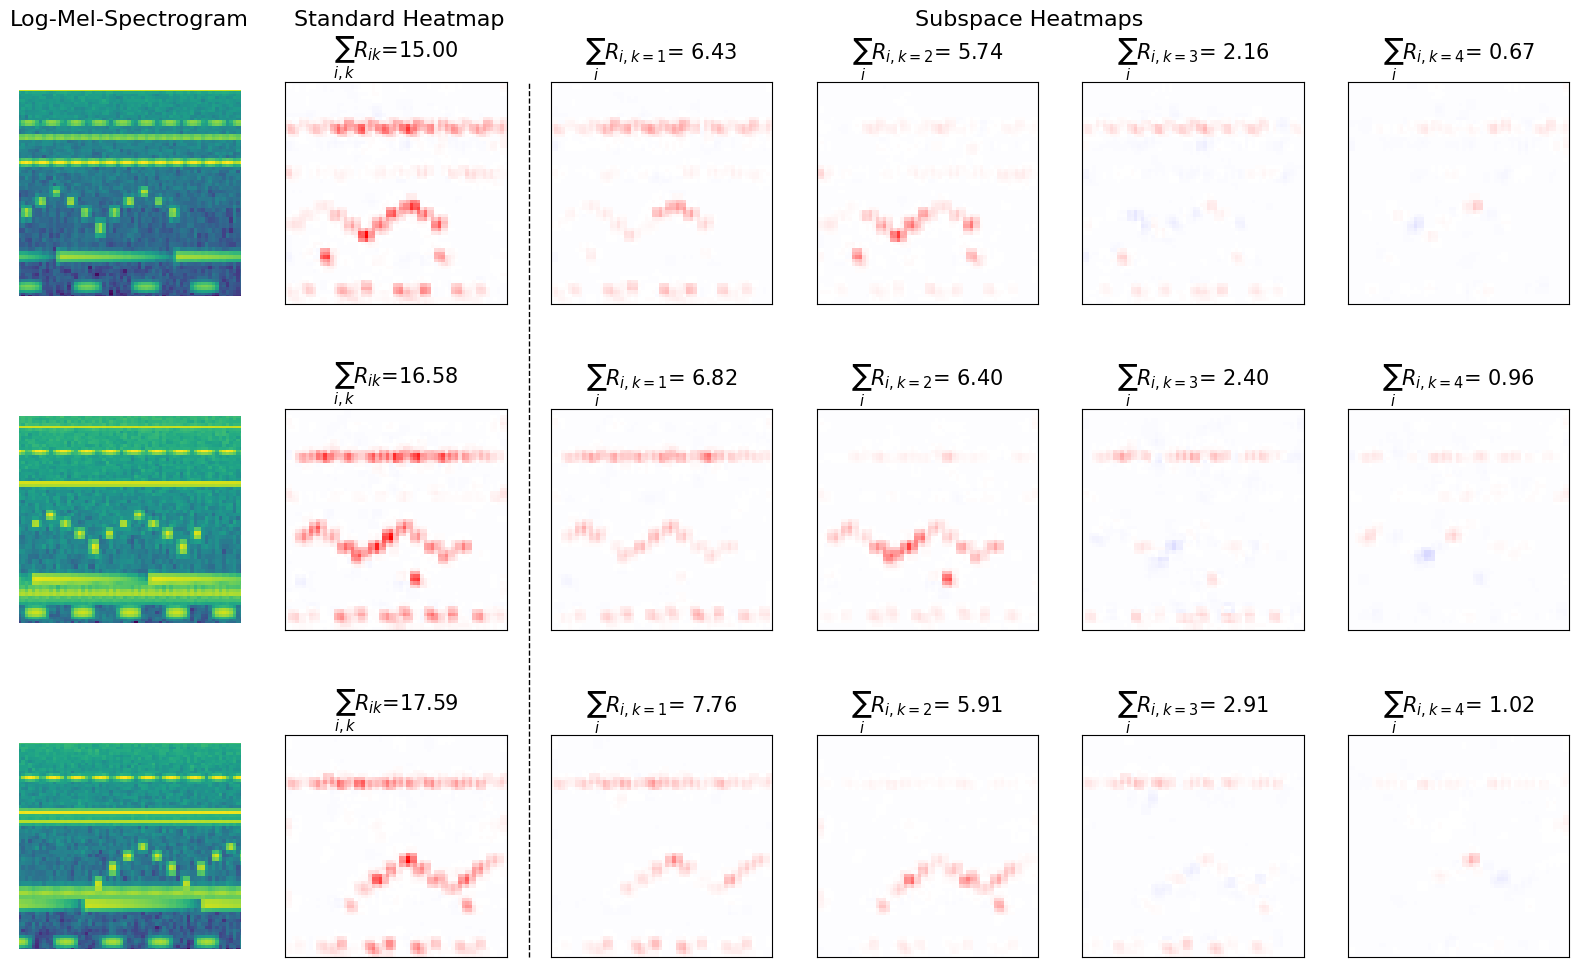
In the following, three different datapoints per class and their repective explanations are depicted. The standard heatmap specifies the local
explanation as extracted with standard LRP. The subspace heatmaps represent the disentangled concept-based explanations as extracted with DRSA and LRP.
In order to enable good visual inspection, the icons to play the associated audios are provided beneath the figures in the same exact order as the images
in the figure.
Class 1
Fig. 1: Displayed from left to right: the original sample, the standard explanation (as obtained with standard LRP),
and 4 explanation components as disentangled with DRSA. The total relevance \(\sum R\) represented by an explanation is stated above
each heatmap. Each row of figures represents one specific sample and its associated explanations.